Venue Statistics
Venue Admin
The statistics section provides an analytical overview of your venue, with aggregated KPIs across all events.
Overview
Access the "Statistics" section from the sidebar to view your venue's global data.
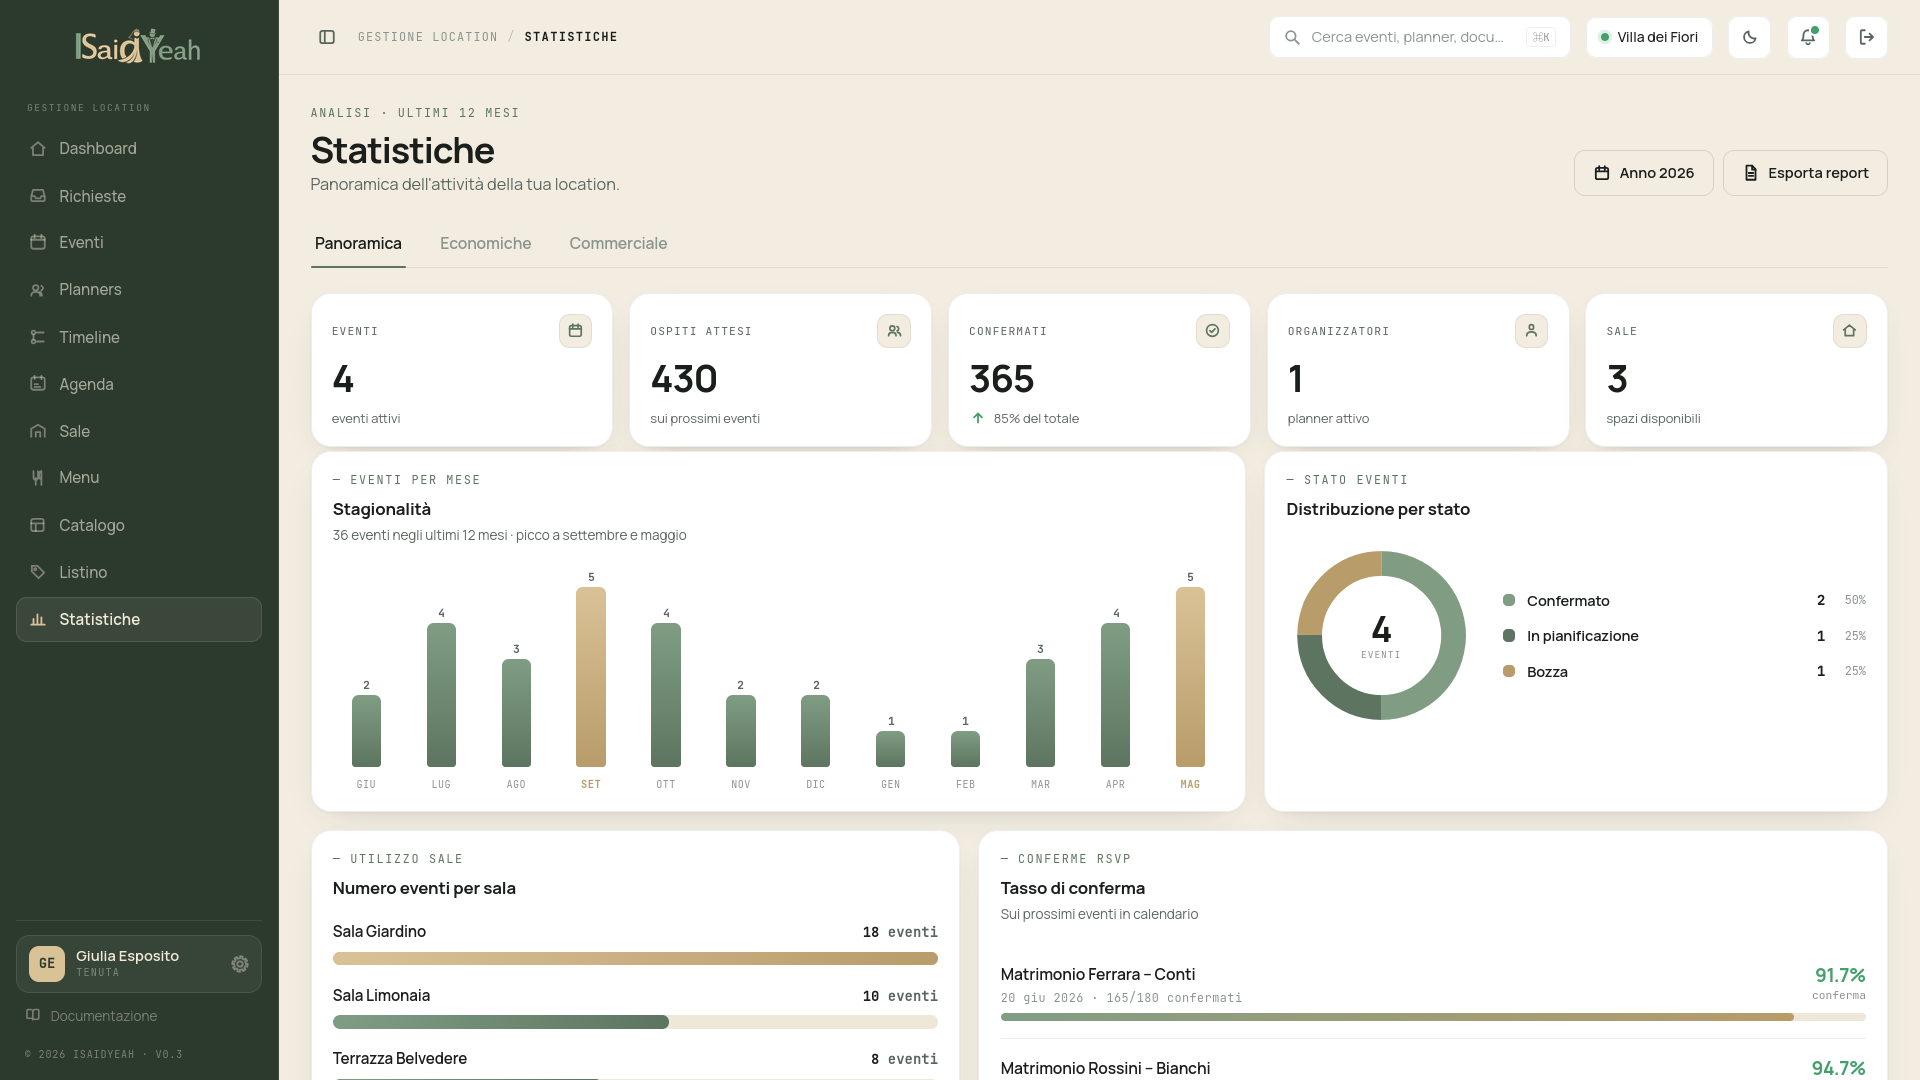
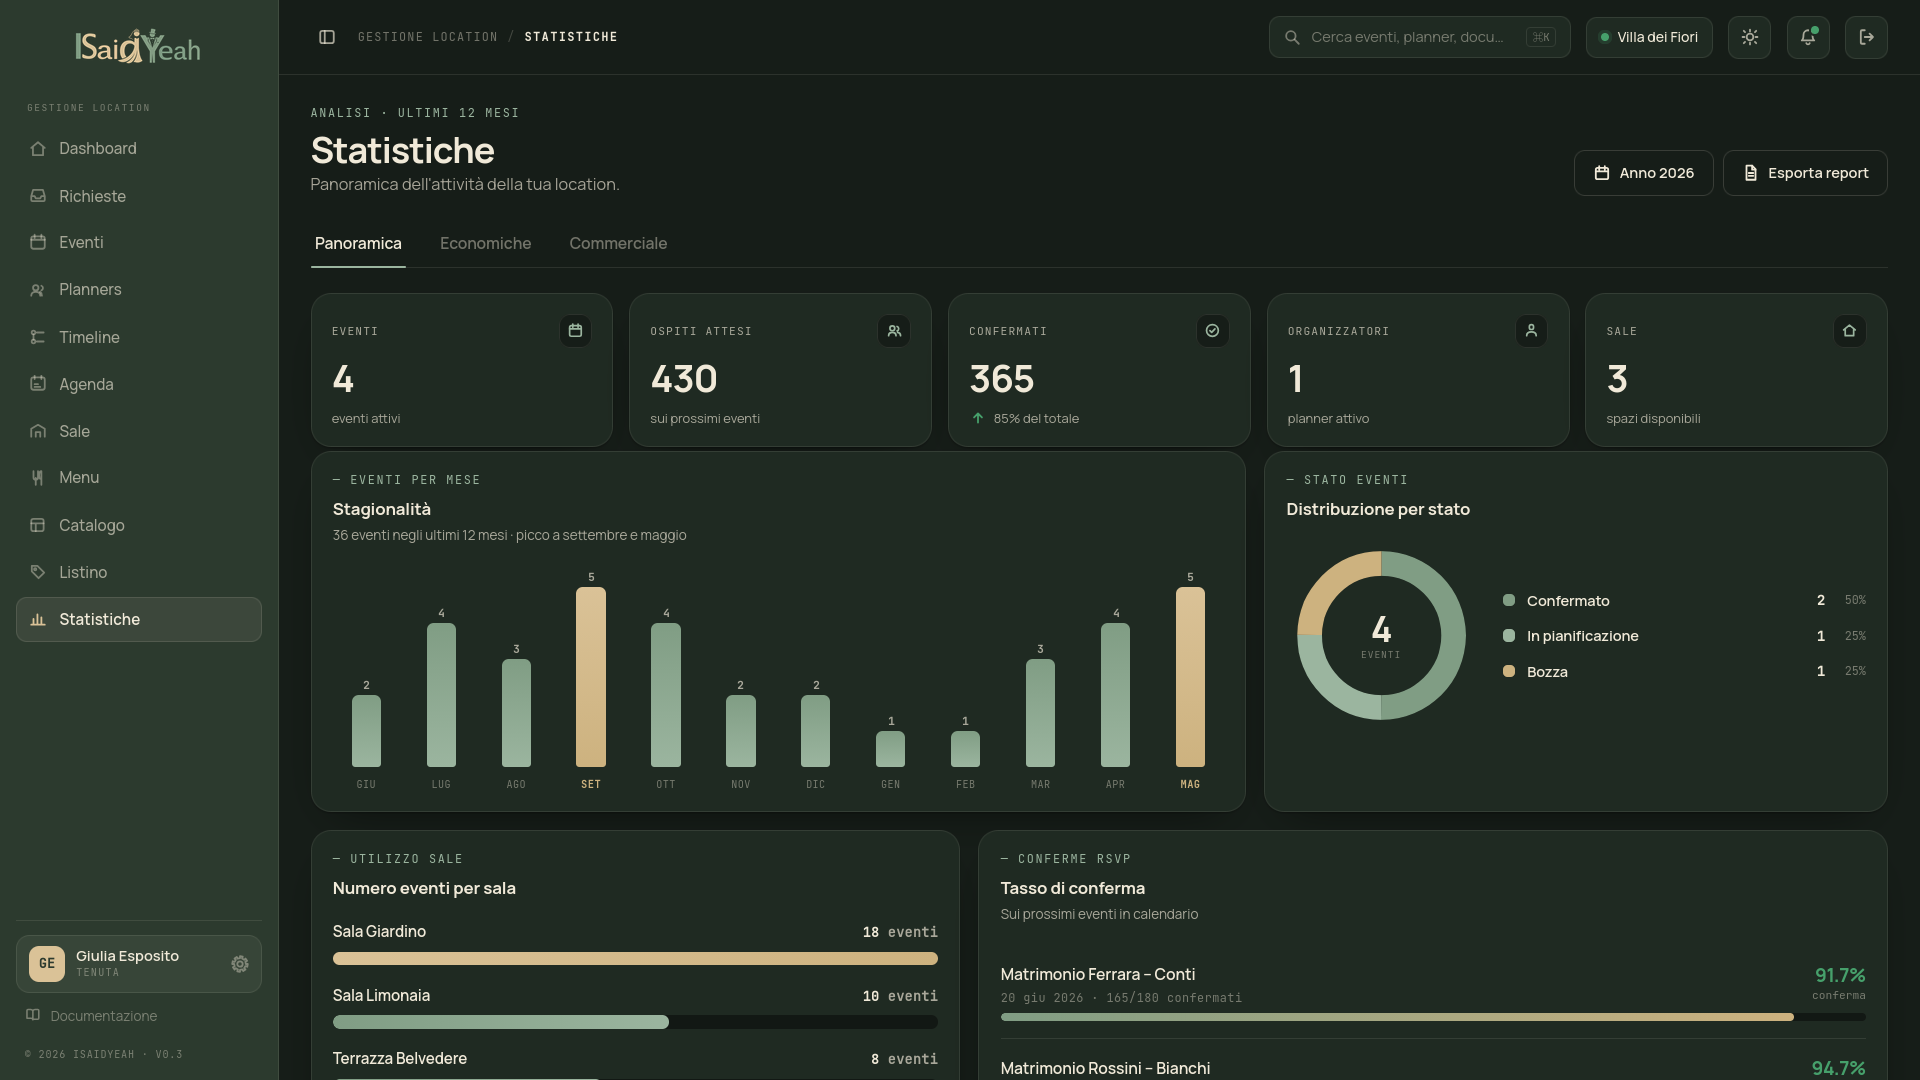
The page is organized into three tabs — Overview, Financials and Commercial — and data can be filtered by period.
Overview
The general tab summarizes venue activity with key cards (total events, expected guests, confirmed, organizers and halls) and the related charts: events per month seasonality, distribution by status, number of events per hall and RSVP confirmation rate.
Financials
The financial tab summarizes the financial trend: cards show collected, quoted, outstanding and overdue amounts. Charts compare collected vs quoted, break down revenue by event type and illustrate the monthly and by-payment-status cash flow.
Commercial
The commercial tab analyzes the request pipeline: cards report the conversion rate, the main acquisition channel and weekend saturation. The "request to confirmation" funnel shows the progression across stages, while the charts highlight lead provenance and weekend saturation per month. This data is based on Requests.
Compare periods
Analyze data across different periods to identify booking seasonality and plan resources accordingly.